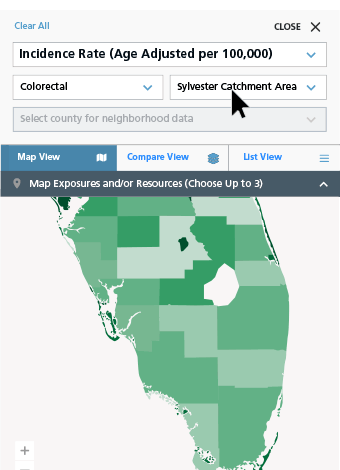
Incidence rate (age adjusted): Incidence rates estimate the number of people out of 100,000 that
will be newly diagnosed with cancer in a particular year or specified period of time by location. Nearly every
cancer becomes more common as people age. So, our rates are statistically age adjusted so that the proportions in
our age 18 age groups (newborn-4 years, 5-9, 10-14, etc…) all match the US 2000 Standard Population.1 Precancerous
(i.e., in situ) lesions are excluded from these estimates (except for bladder cancer).
The estimates use cancer counts from the Florida Cancer Data System (FCDS) between 2012-2016.2 The number of
people living in each location comes from Florida Health Charts in those years.3
Mortality rate (age adjusted): Mortality rates estimate the number of people out of 100,000 who
die from cancer in a particular year or specified period of time and by location. Mortality becomes more common as
people age, regardless of cancer diagnosis, so these rates are statistically age adjusted to that the proportions
in our age 18 age groups (newborn-4 years, 5-9, 10-14, etc…) all match the US 2000 Standard Population.1
Percent Late State Diagnosis: Cancer staging is a way of categorizing how far a cancer has spread
from its point of origin.4 This measure uses the Surveillance Epidemiology and End Results (SEER) summary staging
guidelines. In these data, late stage was defined as having a SEER summary stage of 2, 3, 4, 5 or 7, which include
regional extension with and/or without lymph nodes and distant cancer. Percent late stage diagnosis is the number
of new cancer cases diagnosed at distant stage per 100,000 for a particular period of time, by location.
Years of Potential Life Lost: Years of potential life lost is an estimate of premature mortality
due to cancer for a particular area. Each person who dies before the age of 75 contributes to the total number of
years of potential life lost, whereby a person who dies at age 30 contributes 45 years of life lost, while a person
who dies at age 70 contributes 5 years of life lost. These estimates are presented as the number of years per
100,000 and adjusted to the US 2000 Standard Population.1
- Census 2000 PHC-T-9. Population by Age, Sex, Race, and Hispanic or Latino Origin for the United States: 2000.
United States Census Bureau. [Available from:
https://www.census.gov/population/www/cen2000/briefs/phc-t9/tables/tab01.txt]
- Florida Cancer Data System. [Available from: https://fcds.med.miami.edu]
- Florida Population Estimates. Florida Department of Health. [Available from:
http://www.flhealthcharts.com/FLQUERY/Population/PopulationRpt.aspx]
- Annual Report to the Nation 2017: Incidence Summary. SEER. [Available from:
https://seer.cancer.gov/report_to_nation/incidence.html]